India: Population
|
Population (mid-2012)
1,259,721,000 Density (people per sq. km) 328 Net Migration Rate (# per 1000 people) 0 Birth Rate (# per 1000 people) 22 Death Rate (# per 1000 people) 7 Rate of Natural Increase 1.5% Population Growth Rate 1.5% Infant Mortality Rate (# of deaths per 1000 live births) 378 Total Fertility Rate (average # of children per woman) 2.5 Population Age <15 31% Population Ages 65+ 5% Dependency Rate (add together Population Age <15 % and Ages 65+ %) 36% Life Expectancy at Birth (total) 64 Life Expectancy at Birth Females 65 Life Expectancy at Birth Males 63 Primary School Completion Rate Females 94% Primary School Completion Rate Males 95% Secondary School Enrollment Net Females Data unavailable Secondary School Enrollment Net Males Data unavailable GNI PPP per capita in US$ $3,280 Population Living Below US$2 per day 76% Economically Active Females 15+ 33% Economically Active Males 15+ 81% Mobile Phone Subscribers (# per 100) 29 Motor Vehicles (# per 1000) 18 Undernourished Population 20% Underweight Children Under Age 5 46% HIV/AIDS Among People Ages 15-49 0.3% |
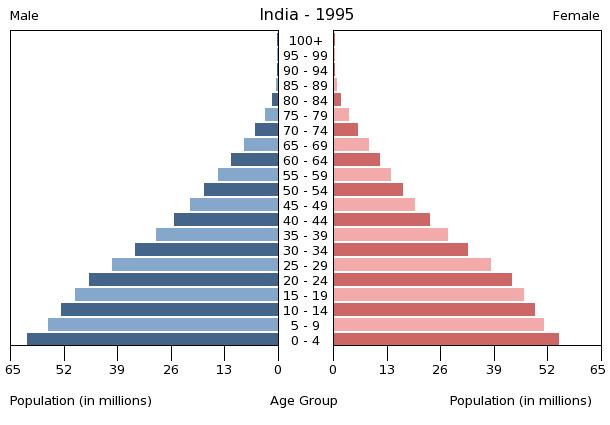
Demographic Transition Model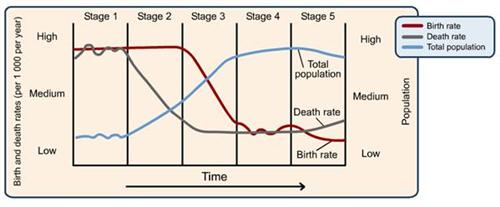
India is considered to be in stage two of the demorgraphic transition model. Although the birth rate is relatively high and the death rate is declining, the high infant mortality rate illustrates the country's low level of development.The population's health standards are too low, resulting in an undernourished population. The education of the youth in India is also lacking as many do not enroll in secondary schools. These conditions combine to produce a low life expectancy.
|
